


Register B — Analytical + Tactical · For: publishers $500–$50K/month organic · ~3,300 words
Technical SEO in 2026: What Actually Matters When 58% of Your #1 Clicks Have Already Disappeared
AI Overviews killed 58% of position-1 organic clicks. Fine. But the part nobody’s saying clearly: CTR is also falling on queries that don’t have AI Overviews at all. Technical SEO can’t fix that. Here’s what it can fix — and how much of your time it actually deserves.
What You Need to Know in 60 Seconds
- Position 1 organic CTR: down 58% when AI Overviews appear (Ahrefs, Dec 2025). Up from 34.5% in April 2025 — accelerating, not stabilizing.
- Zero-click searches are now ~60% of all queries — including queries without AI Overviews. The behavior change extends beyond the feature.
- Core Web Vitals: defense, not differentiation. You need “Good” so you don’t lose to faster competitors. You won’t gain rankings from obsessing over 2.3s vs 2.5s LCP.
- INP replaced FID in March 2024. If you haven’t checked it, you’re working with an obsolete metric.
- Schema deprecated 7 types in January 2026. We have zero public confirmation that ChatGPT/Perplexity use schema. Implement it for Google’s proven features, not AI citation magic.
- The 60/40 rule: 60% content demonstrating expertise. 40% technical SEO. Not the reverse.
The Number Everyone Quotes, and the One Nobody Does
Fifty-eight percent. That’s how much position-1 organic CTR dropped when AI Overviews appeared, per Ahrefs’ December 2025 data. Up from 34.5% in April of the same year. Not stabilizing — accelerating.
That number gets quoted a lot. Here’s the one that doesn’t: CTR declined even on queries that had no AI Overview at all.
Zero-click searches hit roughly 60% of all Google queries in 2024–2025. Meaning 6 out of 10 searches end without anyone clicking anything — not your site, not a competitor’s. People are changing how they search. They’re using Google more like a calculator or a quick answer machine, even on queries that don’t trigger AI features. The AI Overview is accelerating a behavioral shift that was already underway.
That’s the part technical SEO can’t fix. Perfect Core Web Vitals score on a site where user behavior has structurally shifted away from clicking — the perfection doesn’t move the needle. I want to say that clearly before we get into the actual technical work, because the context changes how much time any of this deserves.
Second-Order Mechanism — Why the Decline Is Non-Linear
The AI Overviews CTR data gets reported as a single percentage — “58% at position 1.” That framing implies a step-function change: AI Overview appears, clicks drop by this amount, situation stabilizes. The actual mechanism is different.
Each time a user finds an AI Overview useful, they update their behavior slightly — searching more casually, expecting answers inline, clicking through less often. That behavioral update persists beyond the queries where AI Overviews appear. Seer Interactive’s 15-month tracking data shows consistent month-over-month decline, not a one-time adjustment. The shift is compounding: every month of users learning to trust Google’s inline answers makes the behavior more ingrained, which is why the April 2025 figure (34.5%) reached 58% by December without a major product change in between.
This is also why zero-click behavior extends to non-AI-Overview queries. Users don’t stop and check whether a given query has an AI Overview before deciding how much they intend to click. The habit generalizes.
Core Web Vitals: Defense, Not Differentiation
Let me just say what this is before we get into the specifics. Core Web Vitals is a floor. You need to clear it so that competitors with similar content and authority don’t outrank you on speed alone. That’s the whole job. Spending 40 hours chasing a 2.3s LCP when you’re already at 2.5s is not optimization — it’s displacement activity.
Current Benchmarks (2026)
| Metric | Good | Needs Improvement | Poor (Fix This) | What’s Usually the Culprit |
|---|---|---|---|---|
| LCP (Largest Contentful Paint) | ≤ 2.5s | 2.5–4.0s | > 4.0s — strong ranking signal | Hero images unoptimized, slow server response, render-blocking resources |
| INP (Interaction to Next Paint) — replaced FID March 2024 | ≤ 200ms | 200–500ms | > 500ms — measured across ALL interactions, not just first | Third-party scripts (tag manager, ad networks). Usually not your code. |
| CLS (Cumulative Layout Shift) | ≤ 0.1 | 0.1–0.25 | > 0.25 — jarring for users, clear ranking signal | Ads or embeds without reserved space, late-loading fonts, images without dimensions |
The INP Thing Most People Are Sleeping On
FID measured your first interaction. Click the button, how fast does the page respond. Done.
INP measures every interaction across the whole session. Which changes the diagnostic completely. A site with good FID could have catastrophic INP if — and this is the common pattern — a tag manager is loading 15+ tracking pixels that block the main thread, or ad networks are running JavaScript that competes with user interactions, or event handlers are triggering expensive DOM operations on every scroll.
I see this constantly on publisher sites. The FID scores looked fine for years. INP unveiled that the entire interactive experience was quietly broken.
How to actually check it. Not the 5-minute version. The real one:
// 30-45 minutes, realistically// Step 1: PageSpeed Insights → Field Data tab (real users)// If "field data not available" → you lack Chrome user volume// Lab data is not a substitute for field data on INP// Step 2: If poor INP in field data:// Chrome DevTools → Performance tab// Record while clicking/scrolling for 30 seconds// Look for "Long Tasks" (red bars > 50ms)// Filter by "Experience" to see INP specifically// Step 3: Identify culprit// Usually third-party scripts — check Network tab for GTM firing// Not your custom code. Almost never your custom code.Quick wins if you have CMS access:
<!-- Defer non-critical scripts --><script defer src="/analytics.js"></script><!-- Lazy load below-fold images --><img loading="lazy" src="image.jpg" alt="description"><!-- Add dimensions to prevent CLS --><img width="800" height="600" src="hero.jpg" alt="hero">The honest caveat: Google won’t disclose the exact ranking weight of Core Web Vitals. We don’t know if mobile weighs more than desktop. We don’t know if new metrics are coming. What we do know from ranking case studies is that going from Poor to Good on any single metric produces clearer ranking improvement than going from Good to excellent. Fix the red ones. Don’t obsess over the green ones.
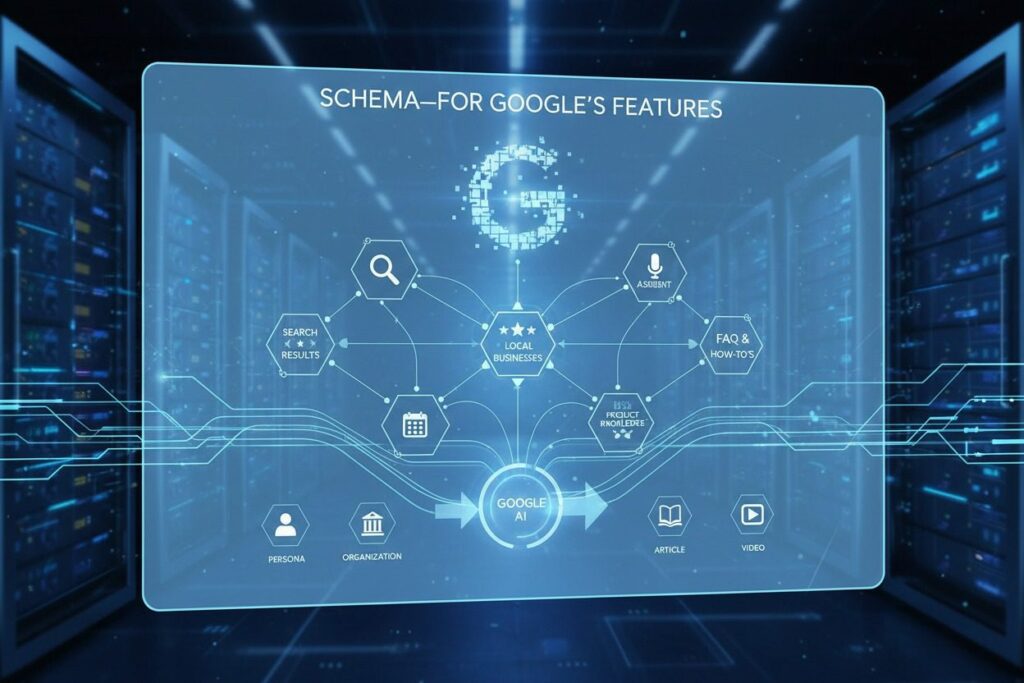
Schema: For Features That Exist, Not Ones You Hope Will
Google deprecated seven schema types in January 2026 — Practice Problems, Datasets, Q&A, and a few others. Schema isn’t dying. Google’s refining what it actually uses to generate rich results. The answer to “should I invest in schema?” depends entirely on what you’re investing in it for.
For traditional Google search: schema drives documented, proven features — Featured Snippets, Product carousels, Knowledge Panels, Recipe results. These are real, they drive real clicks, and basic implementation is worth the time for any site earning meaningful organic revenue.
For AI citations: we have zero public confirmation that ChatGPT, Perplexity, or Claude use schema markup. The closest thing is Microsoft’s Fabrice Canel saying in March 2025 that “Schema helps our LLMs understand content.” One statement from one vendor in one context. Not proof of industry-wide adoption. Not a reason to spend 20 hours on elaborate schema hoping it will get you AI citations. Tier 3 — single vendor statement, not independently corroborated
What to implement and in what order:
Organization schema: Always, first, non-negotiable. Tells Google what your site is. Takes 20 minutes.
{ "@context": "https://schema.org", "@type": "Organization", "name": "Your Company", "url": "https://yoursite.com", "logo": "https://yoursite.com/logo.png"}Article schema: If you publish editorial content. Essential fields: headline, author, datePublished, dateModified, image. Skip the optional fields on the first pass — get it valid, then refine.
Product schema: If you have e-commerce or review content. Essential fields: name, offers (price + availability), aggregateRating. The aggregateRating is what triggers the star display in search results — that’s the CTR improvement you’re actually implementing this for.
Validation: Google’s Rich Results Test. Budget 45–120 minutes including troubleshooting. Not 15. Troubleshooting schema errors is where the time goes.
The AI Overviews Data, Honestly Read
CTR Impact by Query Type — 2025–2026
The niche breakdown matters. AI Overviews appear on 43.6% of science queries, 43% of health queries, 36.8% of pets and animals. Shopping queries: 3.2%. Real estate: 5.8%. Sports: 14.8%. Capstone AI Overviews vertical study, 2025; methodology not fully disclosed — directional by niche
If you’re in health or science publishing, the impact is already severe and getting worse. If you’re in transactional niches — shopping, real estate, local services — the exposure is meaningfully lower. That changes how much of your technical SEO time you should redirect toward the owned-audience problem.
Getting Cited When AI Overviews Do Appear
92% of AI Overview citations come from sites already in the top 10 rankings. Ahrefs analysis, 2025; directional — citation-to-ranking correlation, not causal confirmation So traditional SEO remains necessary for eligibility. Ranking #3 doesn’t guarantee a citation. But not ranking at all guarantees you won’t get one.
What correlates with citation when you do rank: direct answers in the first 50–70 words of the relevant section, H2/H3 headings that match question phrasing closely, structured lists and tables for multi-part answers, and recent content — recency matters more for AI citations than for traditional rankings. The technical implementation of these things is standard on-page SEO. There’s no secret AI schema. Just clear, well-structured answers near the top of relevant sections.
Cross-Source Synthesis — Not in Any Single Source
Four independent datasets in combination produce a finding none of them states directly. Ahrefs shows CTR decline accelerating between April and December 2025 without a major AI Overview product change in between. Seer Interactive’s 15-month tracking shows consistent month-over-month decline, not a step function. Chartbeat’s 2,500-publisher data shows Google search traffic down 33% year-over-year globally. Conductor’s January 2026 data shows all AI platforms (ChatGPT, Perplexity, etc.) combined represent 1% of total publisher traffic.
The synthesis: the decline is behavioral compounding, not feature-driven. Google’s AI Overviews triggered a user behavior shift — searchers learning to expect and trust inline answers — that is now generalizing beyond the queries where AI Overviews appear. The Conductor data is the smoking gun: AI platforms aren’t replacing Google’s lost referrals. There is no alternative traffic source absorbing the loss. Publishers are experiencing a structural reduction in organic click-throughs without a compensating growth in any other channel. Technical SEO optimization cannot address this — it’s a demand-side problem on Google’s end, not a supply-side quality problem on the publisher’s end.
The Time Reality (Because Everyone Lies About This)
What Tasks Actually Take — No Shortcuts
Underbudgeting time guarantees you quit halfway. The SEO post that says “15-minute schema” and the reality that you’re on hour two troubleshooting a validation error — that’s not the post’s failure. That’s just what the work takes. Set realistic time blocks before you start or you’ll abandon implementations mid-way and have worse coverage than when you started.
Actual Priorities by Revenue Tier
$1,000–$10,000/month
Week 1 (2–3 hours)
- PageSpeed Insights on top 10 pages — note any Poor scores
- Add Organization schema if missing (45 min)
- Check Google Search Console coverage for crawl errors
Month 1 (8–12 hours)
- Fix the single worst CWV issue — usually LCP from large hero images
- Article/Product schema on top 5 pages
- Manual search: which of your top keywords trigger AI Overviews? Are you cited?
- If not cited: rewrite the relevant sections with direct answers in first 60 words
Skip for now: INP micro-optimization, crawl budget analysis, hreflang unless you have international traffic
$500–$1,000/month
Do These Three Things
- Core Web Vitals check on top pages — fix anything in Poor range only
- Organization schema (45 min, non-negotiable)
- Update top 3 organic pages with fresh data and direct-answer formatting
Skip: Advanced schema types, INP debugging, technical audit services. Not your constraint yet.
Under $500/month
Honest: This Isn’t Your Problem
- Basic mobile-friendliness check (Google’s Mobile-Friendly Test, free)
- Fix any obvious broken pages in Search Console
- Don’t buy a Screaming Frog license yet
At this level your constraint is content quality and topical authority, not technical SEO. Come back when you’re earning $500+/month consistently.
The 60/40 Rule — My Actual Position
If I have 40 hours this quarter for a $5K/month site, here’s how I actually spend them:
5 hours: Fix any CWV issues in the Poor range. 5 hours: Implement or audit basic schema. 10 hours: Update the top 10 organic pages with original data, better structure, and direct-answer formatting for the queries that trigger AI Overviews. 20 hours: Build an email list and show up consistently in one channel where my audience actually is — a subreddit, a newsletter in the niche, a Discord, whatever the community already uses.
Not: 40 hours optimizing INP from 180ms to 150ms. That’s 30ms. No study I know of documents ranking improvement from that marginal a change when you’re already in the Good range.
“Technical SEO keeps you in the game. The game itself has changed. Winning requires strategy beyond checklists.”
Editorial synthesis — sources: Seer Interactive 15-month CTR data (2025), Chartbeat publisher traffic analysis (2025), Conductor AI traffic report (Jan 2026)
The “build branded search” advice that floats around is usually circular — “create memorable content.” Here’s what actually works. An email list with even 100 engaged subscribers who open your emails beats 10,000 random Google visitors in terms of long-term revenue predictability. One solid original research piece that gets cited beats 50 aggregation posts in terms of authority signals. Showing up consistently in a specific community — answering real questions, not dropping links — builds the kind of reputation that drives branded search without anyone having to manufacture it.
What Genuinely Complicates This
Here’s the honest part. Everything I’ve said about building owned audiences and diversifying away from Google organic traffic runs directly into a short-term revenue problem. Email list growth is slow — 6 to 18 months to build something meaningful. Community presence takes time. Affiliate and direct sponsorship revenue takes relationships.
Meanwhile, a publisher who’s already at $10K/month from organic search can’t just stop optimizing for Google while they rebuild. The triage is real: continue maintaining the channel that’s declining while simultaneously investing in the channels that will replace it. That’s a genuinely difficult position. The 20 hours I’m putting into email and community in my 40-hour example — that’s investment with a longer payback than the 5 hours of CWV fixes that might help organic rankings this quarter.
I’m not going to pretend that’s easy math. It’s not.
For: Content publishers with $5K–$50K/month organic revenue
The Monitoring Problem You Probably Have Right Now
Most publishers at this revenue level are tracking organic traffic and total revenue. They’re not tracking organic revenue per session — the number that actually tells you whether the Google channel is worth the investment on the margin. When traffic drops 10% but revenue only drops 7%, that’s a positive sign. When traffic is flat but revenue drops 12%, that’s a monetization signal. The aggregate numbers hide the dynamics.
Set up a Google Analytics 4 custom report: organic sessions from Search Console, correlated with revenue events, broken down by page. That’s the view that tells you which content is still generating returns from Google organic and which has effectively zeroed out due to AI Overview coverage. The pages that have zeroed out deserve the content update and owned-channel investment time. The ones still performing deserve the technical maintenance time.
For: Site owners doing technical audits before investment decisions
What an Audit Actually Tells You — and Doesn’t
A Screaming Frog crawl plus PageSpeed Insights plus Google Search Console gives you a clean picture of technical issues. What it doesn’t tell you is whether fixing those issues will move revenue, because that depends on whether the pages in question are still generating organic clicks at all given AI Overviews coverage in your specific niche.
Before spending $5,000–$15,000 on a technical SEO agency engagement, manually check the top 20 organic keywords driving your revenue: do they trigger AI Overviews? Are you cited? If the answer is “AI Overview appears, you’re not cited, and the query is informational rather than transactional” — a technical audit isn’t your constraint. Content and citation eligibility is. The audit will find real issues and they’ll be worth fixing, but the ROI depends entirely on whether there’s still organic traffic opportunity on those queries.
What We Genuinely Don’t Know
Some of the most important questions in technical SEO right now are unanswered and anyone claiming certainty is selling something.
On AI Overviews: whether CTR will stabilize or keep compounding as user behavior entrenches further. Whether Google will monetize AI Overviews with ads (that would change the ranking economics completely — publishers who are cited would presumably benefit). When and if ChatGPT and Perplexity provide referral traffic at meaningful scale — right now it’s 1% of publisher traffic per Conductor’s January 2026 data.
On Core Web Vitals: the exact ranking weight is not disclosed. We don’t know whether mobile performance weighs more than desktop. We don’t know if battery usage or data consumption will be added as metrics — there’s been speculation but no confirmation. Don’t optimize for metrics that don’t exist yet.
On schema for AI: the honest answer is we don’t know if it helps with AI citations. Implement it for Google’s proven features and treat any AI citation benefit as a possible upside, not the primary reason.
Sources & Verification Notes
- Ahrefs: AI Overviews Reduce Clicks — December 2025 update. Position-1 CTR down 58%. Tier 1 — large-scale ranking data from Ahrefs’ own crawler. April 2025 original: 34.5% decline.
- Seer Interactive — 15-month organic CTR tracking. 1.76% to 0.61% organic CTR. September 2025. Tier 2 — agency tracking of client portfolio, not a random sample.
- Search Engine Land: Amsive AI Overviews CTR Study. −15.49% average CTR impact; −37% with Featured Snippet present. Tier 2.
- Conductor: AI Platform Traffic Report, January 2026. AI platforms (all combined) = 1% of total publisher traffic. Tier 2 — Conductor is an SEO platform with commercial interest in SEO investment; directional.
- Chartbeat, 2,500+ publisher analysis, 2025: Google search traffic down 33% YoY globally. Tier 2; Chartbeat methodology is well-regarded in publishing industry, sample size is meaningful.
- web.dev: INP Official Documentation. INP replaced FID March 2024. Tier 1 — Google’s own developer documentation.
- Google Structured Data Policies. Schema type deprecations January 2026. Tier 1.
- Microsoft’s Fabrice Canel, statement on schema and LLMs, March 2025. Tier 3 — single vendor statement; not independently corroborated across industry.
- Capstone: AI Overviews 2025 CTR Impact — vertical breakdown (science 43.6%, health 43.0%, shopping 3.2%). Tier 2; methodology partially disclosed.
Enterprise AI SEO in 2026: The New Rules for Ranking, Revenue, and Search Dominance
Master Core Web Vitals in One Hour
How Rich Snippets Increase Organic Traffic (With Real Examples)
Half the Web Still Fails Core Web Vitals in 2026 — And the Gap Isn’t Closing Fast Enough
Google AI Overviews 2026: Who’s Actually Losing Traffic and Why
Is the Google Indexing API Free? 2026 Pricing, Quota Limits & Hidden Costs Explained